Tuesday, April 29, 2014

Post #7: Exploring a Data Visualization

I've encountered a number of interesting data visualizations during this seminar. Some of the most impactful of these visualizations use data to illuminate social and environmental issues (see Prof. Barry's post about the NYPD Stop & Frisk Visualization and Prof. Rahman's post about the World Map of CO2 Emissions). Of all the visualizations, however, I've spent the most time interacting with The Scale of the Universe 2. This visualization, created by Cary and Michael Huang, was introduced by Prof. Henshaw earlier in the seminar. It presents the seemingly-impossible task of visualizing the scale of all things, from the smallest known things (quantum foam and strings, at the scale of 10-35), to the largest known thing (the edge of the observable universe, at the scale of 1027). Because data visualizations deal in fabricating the experience of human perception, it is no surprise that this particular visualization begins at the human scale of 100. From here, you use a scroll bar to zoom in either direction, from the infinitesimal to the possibly infinite. As you scroll, you are presented with presumably accurate scale illustrations of animals, objects, particles, planets and galaxies. Clicking on any particular illustration will bring up a dialog box with a Wikipedia-ish description of the thing. There is so much to take-in, and you could literally spend hours looking through all of the content. If you spend more that a couple minutes, though, I recommend turning off the accompanying 1990's computer game soundtrack.

The only real limitation of this visualization is that it cannot include every known or observable thing (where is an automobile? a houseplant? a two-story house?). I could imagine presenting this site as a tool for discussing scale and perception in a studio art class. There is a long-standing Romantic tradition in the arts of viewing the surrounding world through the lens of the sublime. Anything that feels too large or complex to describe through individual human experience falls into this realm of perception. Even though The Scale of the Universe 2 vizualization has clearly mapped a path from subatomic particles to the broadest view of the universe, I don't believe that I could ever truly fathom the full scope and complexity of these relationships.

Screenshot from The Scale of the Universe 2 visualization; human scale, 100

Screenshot from The Scale of the Universe 2 visualization; smallest known scale, 10-35

Screenshot from The Scale of the Universe 2 visualization; largest known scale, 1027

Casper David Friedrich, "Wanderer Above the Sea of Fog," 1818

Friday, April 11, 2014

Post #6: Annotating Google Earth

I downloaded Google Earth to my computer and I spent a lot of time zooming in and out of different places, but I was not able to successfully create a .KMZ file. There's a time-sucking, almost hypnotizing quality to using this software. No matter what task I gave myself (first to locate land art and ancient geolyths, then to locate the best pizzerias in NYC), I inevitably began "wandering." For the project, I decided to annotate a map of current exhibitions in the city that I intend to see. This could be a very useful tool for students on field trips. In my Intro to Art class, for example, we often go on field trips to the Chelsea and Lower East Side galleries. I ask them to compare works they see in different galleries, and I generally provide a list of suggested galleries to visit. Although, they may not be able to access Google Earth on their smart phones, an annotated Google Maps could be a very useful tool to keep all of the recommended galleries in one place. This would be equally helpful to traverse the maze that is the Lower East Side as well as the seemingly-endless grid of Chelsea. Since my Intro to Art students keep blogs where they post their course activities, I could also imagine having them annotating and posting links to their own Google Maps to show where exactly they visited on that particular trip.

UPDATE:
I finally figured out how to annotate a Google Map. I had to go to "classic view" to find the options. Below is an example of an annotated map for a field trip to the Chelsea galleries. I was able to include information about exhibiting artists as well as images from each exhibition. One feature that I really appreciate is that I was able to separate galleries into two separate layers, "Most Recommended Exhibitions" and "Also Worth Seeing." I color-coded the exhibitions based on these categories so that students can easily access my recommendations on the go from their smartphones.

Link to annotated Google Map:
https://mapsengine.google.com/map/edit?mid=z_ZdcqkY3oJs.kiUDNpwGYmAY

Screenshot of annotated map:

Saturday, April 5, 2014

Post #5: Exploring a Mapping/GIS Project

I came across a recent article on the art blog Hyperallergic that discusses a number of different land art mapping resources. In the classroom setting, these tools present the possibility for virtual field trips. Many earthworks are located in remote areas, and taking a class field trip to a crater in Arizona is not always possible. GIS technology allows the viewer a more immersive experience than viewing site-specific images, alone. Google Earth helps give context to where these earthworks exist in space. An arial photo of  Robert Smithson's "Spiral Jetty" (below) gives us clues about its materials and its relative scale. However, when we zoom-out using GIS tools, we gain perspective on how minuscule this earthwork truly is in relation to the surrounding Great Salt Lake.

Image of Robert Smithson's "Spiral Jetty," 1970


"Spiral Jetty" as seen from a distance in Google Maps. The point of the marker pretty much covers-up the earthwork.

"Land Art of the West" is an excellent resource for using Google Maps to find land art in the Western U.S. Although this site is fairly limited in its geographic scope, there are many seminal works listed. This project was created by a user on Google Maps and it can be downloaded as a .KML file. Annotations are fairly limited, but links to external sources are provided for more information.

"Monumental Land Art" is another resource for finding seminal earthworks. This collection, curated by artist Don Seeley, offers satellite and topographical images from Google Earth, along with the map coordinates for each earthwork.

"Ends of the Earth" is a Google Earth project created by the Museum of Contemporary Art in L.A. This project was made in association with a land art exhibition of the same name. This resource is by far the most professional-looking and informative. It features earthworks from locations around the world. A .KLM file can also be downloaded.


The author of the post presented screen shots of select earthworks, courtesy of Google Earth:

James Turrell's "Roden Crater" in Google Earth
James Turrell, “Roden Crater,” 1978-current, as seen in Google Earth

Walter De Maria's "Lightning Field" in Google Earth
Walter De Maria, “Lightning Field,” 1979, as seen in Google Earth

Michael Heizer's "Double Negative," as seen in Google Earth
Michael Heizer, “Double Negative,” 1969, as seen in Google Earth
It would be great to use one of these resources to compare contemporary earthworks with ones made by ancient and indigenous peoples (the Nazca Lines in Peru, or the Atacama Giant in Chile). If I cannot find an existing project like this, it would probably be easy enough to create a .KLM of my own. 


The Atacama Giant, Atacama Desert, Chile, as see in Google Earth

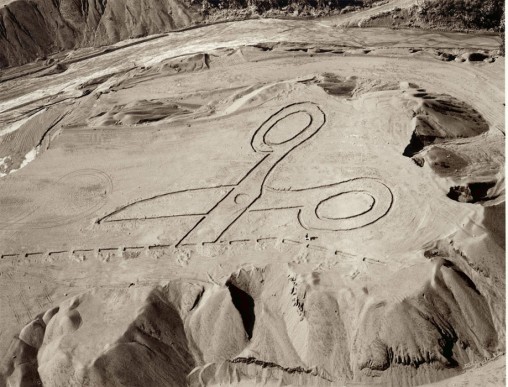
Vik Muniz, "The Sarzedo Drawings," 2002, not seen in Google Earth